rlenterprises66
New member
- Joined
- Jul 7, 2019
- Messages
- 2
- Reaction score
- 0
- Points
- 0
- Excel Version(s)
- Excel for Office 365
Hello,
First post here!
I'm pulling my hair out trying to transform some time series data from a JSON file using Power Query. I have attached the JSON file of interest (note that I had to add .txt onto the end to get it to upload here).
This file contains 4 Items which each have 2 paired timestamps / data points. The timestamps are (and always will be) the same for all items. Ideally, I'd like to transform this JSON file into a table as follows:
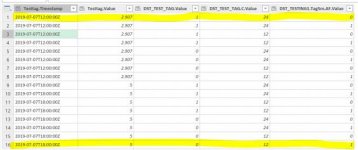
I thought I was onto something using the script below but my rows are being exponentially increased as I expand out the data :doh:
In this example where there are only 2 data points for each Item, the first and last rows end up with the correct data. However, as more data points are added, this isn't the case. The correct rows end up mixed all over in the data set.

Any help would be greatly appreciated!
Thanks, Rhett.
First post here!
I'm pulling my hair out trying to transform some time series data from a JSON file using Power Query. I have attached the JSON file of interest (note that I had to add .txt onto the end to get it to upload here).
This file contains 4 Items which each have 2 paired timestamps / data points. The timestamps are (and always will be) the same for all items. Ideally, I'd like to transform this JSON file into a table as follows:
| Timestamp | Testtag | DST_Test_Tag | DST_TEST_TAG.C | DST_TESTING1.Tag5m.AF |
| 2019-07-07T12:00:00Z | 2.907 | 1 | 24 | 0 |
| 2019-07-07T18:00:00Z | 5 | 0 | 12 | 1 |
I thought I was onto something using the script below but my rows are being exponentially increased as I expand out the data :doh:
Code:
let
    Source = Json.Document(File.Contents("C:\Users\rcl\Desktop\JSON Test Data.json")),
    Items = Source[Items],
    #"Converted to Table" = Table.FromList(Items, Splitter.SplitByNothing(), null, null, ExtraValues.Error),
    #"Expanded Column1" = Table.ExpandRecordColumn(#"Converted to Table", "Column1", {"Name", "Items"}, {"Column1.Name", "Column1.Items"}),
    #"Transposed Table" = Table.Transpose(#"Expanded Column1"),
    #"Promoted Headers" = Table.PromoteHeaders(#"Transposed Table", [PromoteAllScalars=true]),
    #"Changed Type" = Table.TransformColumnTypes(#"Promoted Headers",{{"Testtag", type any}, {"DST_TEST_TAG", type any}, {"DST_TEST_TAG.C", type any}, {"DST_TESTING1.Tag5m.AF", type any}}),
    #"Expanded Testtag" = Table.ExpandListColumn(#"Changed Type", "Testtag"),
    #"Expanded Testtag1" = Table.ExpandRecordColumn(#"Expanded Testtag", "Testtag", {"Timestamp", "Value"}, {"Testtag.Timestamp", "Testtag.Value"}),
    #"Expanded DST_TEST_TAG" = Table.ExpandListColumn(#"Expanded Testtag1", "DST_TEST_TAG"),
    #"Expanded DST_TEST_TAG1" = Table.ExpandRecordColumn(#"Expanded DST_TEST_TAG", "DST_TEST_TAG", {"Value"}, {"DST_TEST_TAG.Value"}),
    #"Expanded DST_TEST_TAG.C" = Table.ExpandListColumn(#"Expanded DST_TEST_TAG1", "DST_TEST_TAG.C"),
    #"Expanded DST_TEST_TAG.C1" = Table.ExpandRecordColumn(#"Expanded DST_TEST_TAG.C", "DST_TEST_TAG.C", {"Value"}, {"DST_TEST_TAG.C.Value"}),
    #"Expanded DST_TESTING1.Tag5m.AF" = Table.ExpandListColumn(#"Expanded DST_TEST_TAG.C1", "DST_TESTING1.Tag5m.AF"),
    #"Expanded DST_TESTING1.Tag5m.AF1" = Table.ExpandRecordColumn(#"Expanded DST_TESTING1.Tag5m.AF", "DST_TESTING1.Tag5m.AF", {"Value"}, {"DST_TESTING1.Tag5m.AF.Value"})
in
    #"Expanded DST_TESTING1.Tag5m.AF1"
In this example where there are only 2 data points for each Item, the first and last rows end up with the correct data. However, as more data points are added, this isn't the case. The correct rows end up mixed all over in the data set.

Any help would be greatly appreciated!
Thanks, Rhett.

