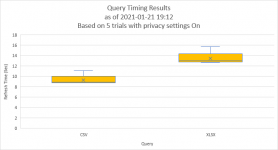
In order to get a speed test of a block of code I create a query that performs just the steps I want to analyze, make sure it loads to a worksheet or the data model, and then run the TimeSleuth feature of my
Monkey Tools add-in on it.
[/COLOR]It's hard to say without knowing what your code does, as different operations can affect things in different ways. What you could try is making a backup of your file, duplicate the query that is taking too long, then split it in half by right clicking and choosing "Extract Previous" on one of the applied steps. Load both those and test the speed of each. The second query in that chain will always take longer than the first, but if the time is very close, then the problem step is in the first half. If the second query takes way longer, then you know the problem step is in that area.
To narrow it down, set the query you aren't concerned with to connection only, then repeat the process of splitting the problem one in half until you identify the step that is causing the longer load.
Honestly, this is a painful situation, and involves a lot of waiting. I wish we had the Query Diagnostics in Excel that Power BI has. But until we do, this is how I would approach it. (To be fair, the more you do this you can look at the operations in the Query Sleuth and identify things that might take longer... merges, sorts, reordering are all things that would become my first targets when perf testing.


