vladimirkiprijanovski@gma
New member
- Joined
- Oct 27, 2024
- Messages
- 1
- Reaction score
- 0
- Points
- 1
- Excel Version(s)
- Excel 2016
Hi to all Excel experts,
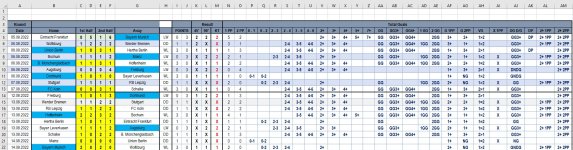
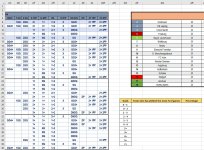
I want to make a statistic table that will show which soccer teams have the highest prevalence in goals scored when they played against other teams over the whole season. The source of those goals is in the columns P thru Z and the table that will show these soccer teams and its percentage is in AO28:AR39.
Just to give you an example, let's compare which soccer teams had the most frequent number of goals 0-1. If we do the manual count of 0-1 occurrence in column P we can determine that there were four teams with the highest prevalence of 0-1 goals in 8 out of 31 games played (25.81%). That same calculation can be done for other criteria such as 2+, 3+ or more goals per game.
What I need is actually a formula that can count this percentage for me. I am using Excel 2016 so unfortunately, I can't use XLOOKUP function. So, I guess the formula should contain formulas such as INDEX, MATCH, VLOOKUP or even some statistical formula.
I have attached the file for you to review it.
Any idea how the formula should look like?
Thanks everyone in advance.